Table of Contents
Key Takeaways
- Branding and advertising within the clothing industry had the greatest range of gender representation (29.8% mixed) and race representation (49.1% mixed).
- Across all industries, 2.9% of branding images included LGBTQ+ representation, 2.4% included body diversity, and 0.3% included disability representation.
- 52.7% of survey respondents felt diversity in branding was important to them when making a purchasing decision; and bisexual and gay respondents were 43.7% more likely than straight respondents to feel diversity and representation mattered in branding.
Feeling Included
America has a diverse population, but is this adequately conveyed in today’s marketing? Branding images from over 100 companies across six industries were analyzed to get a clearer picture of representation in 2021. Did branding show diversity across gender, age, and race? How often were LGBTQ+ and individuals with disabilities represented? Was it common for brands to show different body types, thereby increasing body positivity? Did representation fluctuate by industry?
After looking for patterns in representation, 1,000 individuals were surveyed to gain insight into the impact representation in branding has on the consumer. How does it affect purchase behavior? Was it important for respondents to see diversity showcased by brands? Are certain forms of diversity considered more important than others? We also explored different diversity initiatives and campaigns from brands our respondents strongly identified with to evaluate what may have led to their success. Keep reading to learn more about representation in branding.
Demographics of Representation
Seeking demographic information across six different industries, we analyzed 340 different branding images from 114 companies. Which ages, genders, and races were most commonly represented within these images? How did representation differ based on industry?
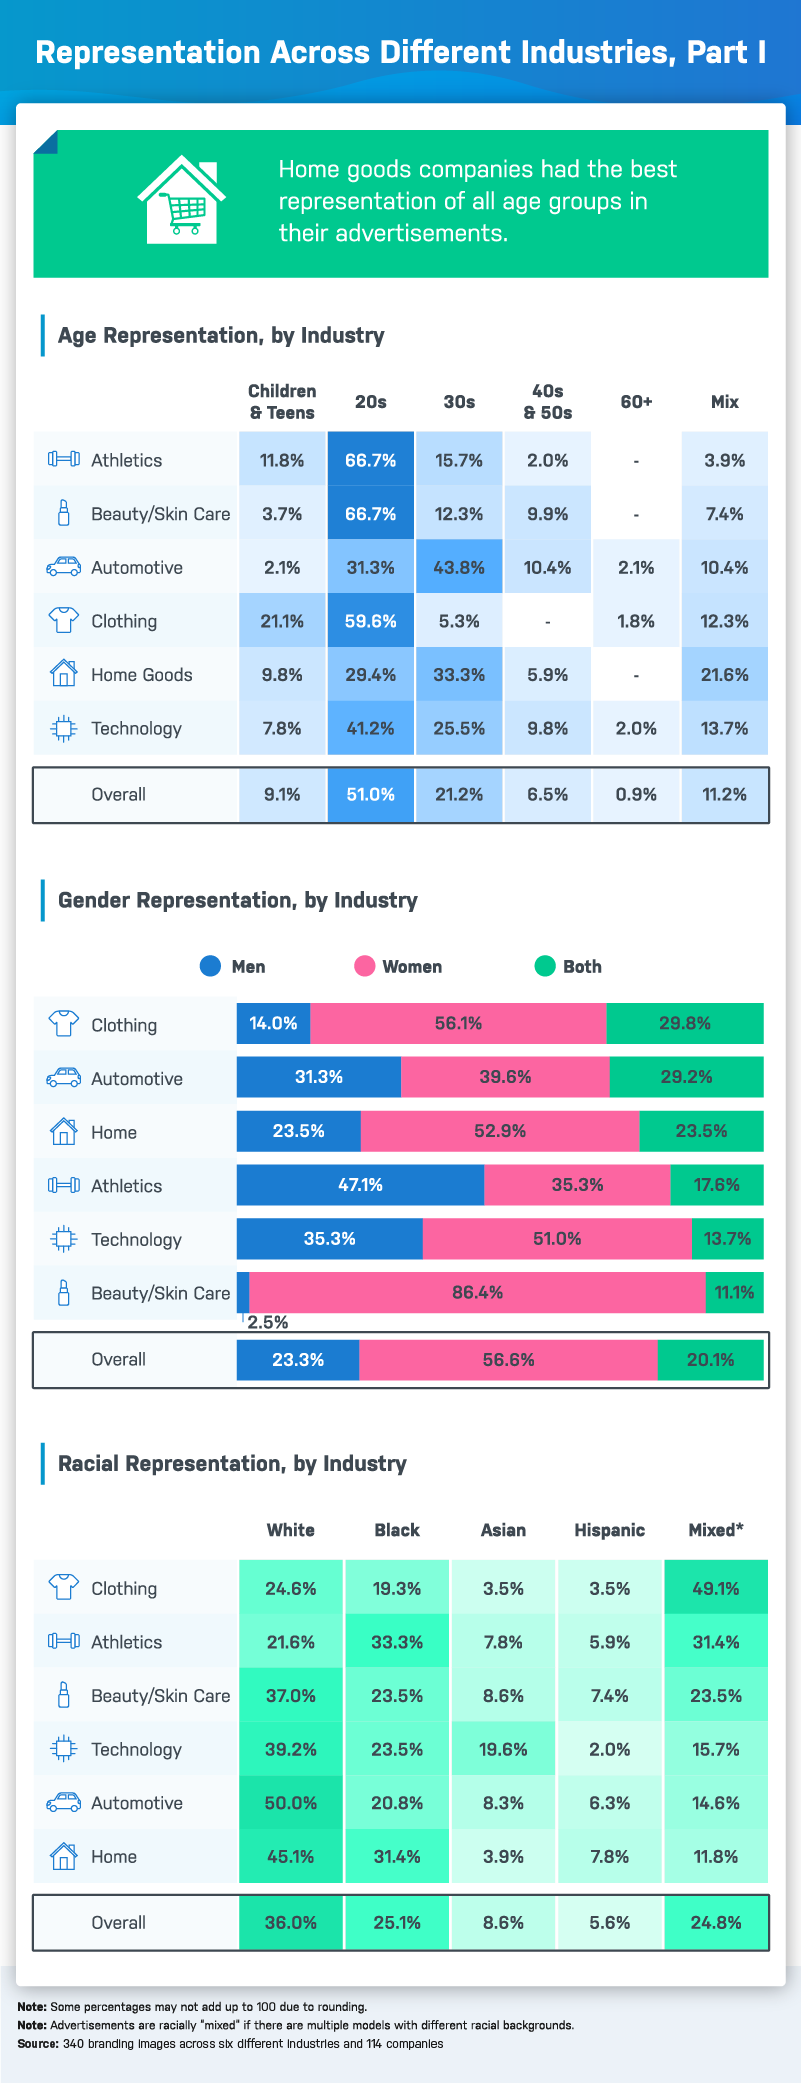
The industries assessed included the following: athletics, beauty/skin care, automotive, clothing, home goods, and technology. Overall, their branded images were most likely to show women (56.6%) and people in their 20s (51%). As for overall racial representation, it seems that white individuals were most frequently shown at 36%. 24.8% of adverts included mixed racial representation, where the models or actors included were from a variety of different backgrounds. Minorities such as Blacks (25.1%), Asians (8.6%), and Hispanics (5.6%) were also sometimes featured on their own, which was still much lower relative to white representation.
However, representation also varied considerably across each of the six industries. Athletics branding, for example, showed Black and mixed ethnicities (33.3% and 31.4%), men (47.1%), and people in their 20s (66.7%) most often. Older individuals were seldom included in their branding. People in their 60s and over were not represented in this industry’s tagged images at all. In contrast, kids and teenagers were occasionally represented at 11.8%.
For the purpose of this study, the beauty and skin care industries were combined. These industries were heavily dominated by female representation. Only 2.5% of brand imaging included men by themselves. Again, younger individuals in their 20s (66.7%) were the most likely to be featured. As for racial representation, 37% of images included whites only. But as with the overall statistics, the accumulation of minorities and mixed races totaled greater representation.
The automotive industry was more likely to show individuals in their 30s (43.8%) than the previous industries discussed. Representation by gender was fairly neutral as 31.3% featured men only, 39.6% featured women only, and 29.2% included both genders. Interestingly, this industry had the highest representation of white individuals at 50%. In this industry, representation of minorities and mixed races did not outweigh the representation of whites, but they were equal.
Clothing industry branding was again dominated by models and actors in their 20s at 59.6% but included representation of mixed ages and all other age groups except 40s and 50s. It’s important to note, in this study, age data is based on perception rather than fact, as the true ages of the models and actors were not known. Representation of mixed races (49.1%) and women (56.1%) were most prevalent. This was one of only two industries for which mixed representation exceeded white-only representation, setting an admirable precedent for diversity.
Out of the six different industries, home goods was the most likely to show a mix of ages (21.6%). Again, women were more heavily represented than men (52.9% versus 23.5%). When it came to racial representation, whites were once again the most commonly shown (45.1%).
The last industry, technology, showcased a variety of different ages. But young people in their 20s (41.2%) and women (51%) were the most commonly shown. Representation of Asians (19.6%) was the highest across all of the included industries. Simultaneously, technology had the lowest industry representation of Hispanics (2%).
It is notable that solo representation of women exceeded that of men in 5 out of 6 categories. The athletic industry was the only exception. This is most likely explained by the fact that women drive 70% to 80% of all consumer purchasing and generally spend more time than men making decisions for their families about consumer goods and services.
Levels of Diversity
The same set of branding images were used to assess additional dimensions of diversity in the same six industries. These include LGBTQ+ diversity, i.e., the inclusion of individuals across a sexual spectrum. Some of these individuals may be nonbinary, meaning they don’t fully identify with either gender. Body diversity includes body shapes that go beyond the average model type, while disability diversity represents handicapable individuals with physical disabilities.
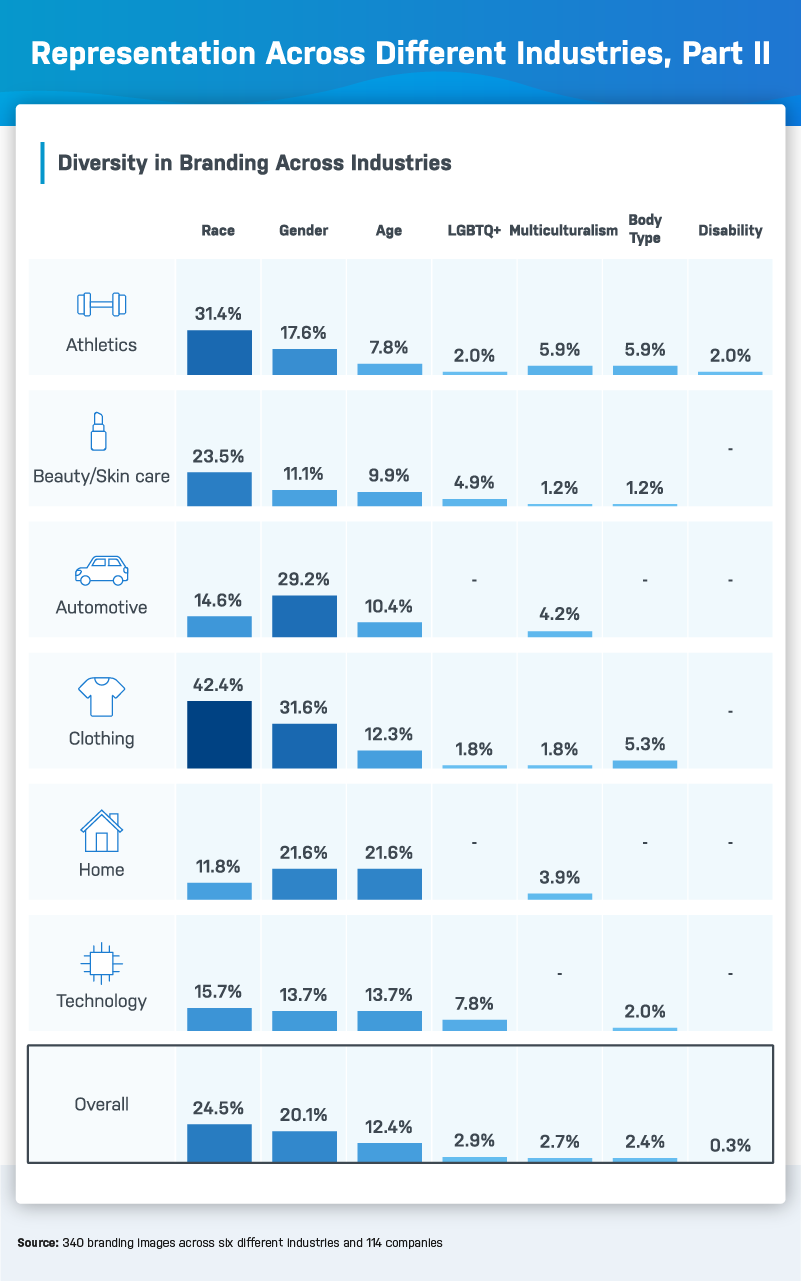
Overall, the most represented form of diversity shown across industries was race (24.5%). This was followed by gender (20.1%) and then age (12.4%). As touched on above, the clothing industry offered the highest levels of diversity in terms of race (42.4%) and gender (31.6%). Home goods, however, represented the greatest level of age diversity (21.6%). Additional types of diversity were significantly underrepresented, falling to less than 3%, respectively.
Body diversity was included in 5.3% of tagged images for the clothing industry and 5.9% of those for the athletic industry. However, the overall percentage for body diversity representation across all industries was much lower at 2.4%. The low diversity here is interesting to note since the average American woman wears a dress size of 16–18, while models (editorial and runway) are generally taller than 5’9 with specific small measurements.
LGBTQ+ diversity ranked low overall at 2.9%. The industry most likely to be inclusive of LGBTQ+ individuals in its branding efforts was technology (7.8%). Both the home goods and automotive industries reported no representation at all. This does not come as a surprise for automotive, since the No. 1 reason people are reluctant to join that workforce is lack of diversity, equity, and inclusion.
Overall, representation of individuals with disabilities was the lowest. Only 0.3% of all branding images evaluated contained disability diversity. All instances that were reported fell under the athletics industry. Incorporation of handicapable individuals in this industry’s branding may be directly connected to the fact that 2021 was a Paralympic year.
Representation’s Impact
After exploring representation across these six industries, we surveyed 1,000 people to learn about the impact representation has in branding. What role did branding play in our respondents’ purchasing behavior? How did the importance of multiple forms of diversity change according to respondents of different genders and sexual orientations?
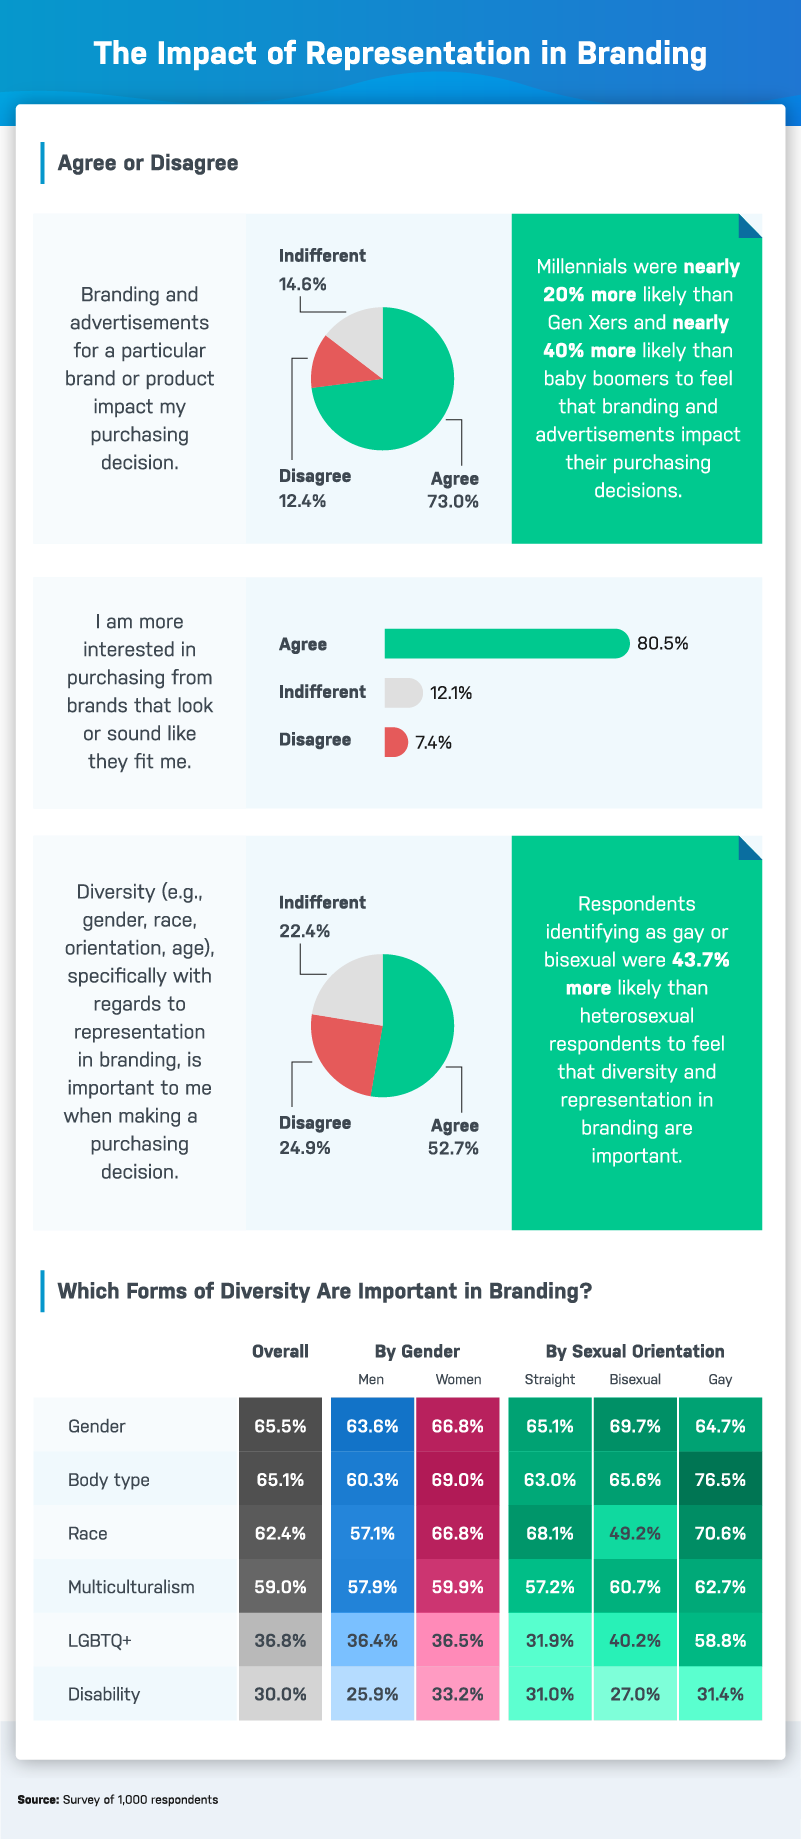
Respondents were asked if branding and advertisements for a particular product or brand impacted their purchasing decision. Overwhelmingly, 73% agreed that they played a role in whether they would buy a product. For one generation, they played a bigger role in the decision-making process than others. Millennials were nearly 20% more likely than Gen Xers and nearly 40% more likely than baby boomers to feel the impact of branding on what they chose to buy.
Consumers were significantly more interested in brands they felt compatible with. Specifically, respondents identifying as bisexual and gay were 43.7% more likely than ones identifying as straight to feel that diversity and inclusion in branding are important. Thus, if companies want to encourage positive feelings within the American melting pot, they should make every effort to be more inclusive of different genders, sexual orientations, races, body types, ages, cultures, and disabilities.
To further determine the impact of inclusion in branding, respondents ranked the importance of different types of diversity. The overall top four included gender (65.5%), body type (65.1%), race (62.4%), and multiculturalism (59%). Gender diversity held the greatest importance to bisexual respondents (69.7%). Meanwhile, gay respondents (76.5%) and women (69%) thought body diversity was most important. Interestingly, bisexual respondents ranked racial diversity (49.2%) as significantly less important than other demographic groups, but the importance of multicultural diversity was consistent across all genders and sexual preferences.
The additional two categories that ranked lower in overall importance were LGBTQ+ (36.8%) and disability diversity (30%). Respondents identifying as gay (58.8%) and bisexual (40.2%) ranked LGBTQ+ representation as more important than straight respondents (31.9%). But even members of the LGBTQ+ community placed a higher importance on the overall top four categories as mentioned above. As for the inclusion of people with disabilities, women (33.2%) were more likely than men to consider it important (25.9%). It is curious that inclusion of people with disabilities was given such low importance, since the CDC reports 1 out of every 4 adults in the United States has a disability. However, some disabilities may be imperceptible and not easily portrayed in branding.
Diversity Initiatives in Popular Companies
We have learned that individuals are more likely to purchase from a brand with which they self-identify. Which brings us to the question, which brands did our respondents align with most? Respondents were polled about brands within the six industries previously discussed.
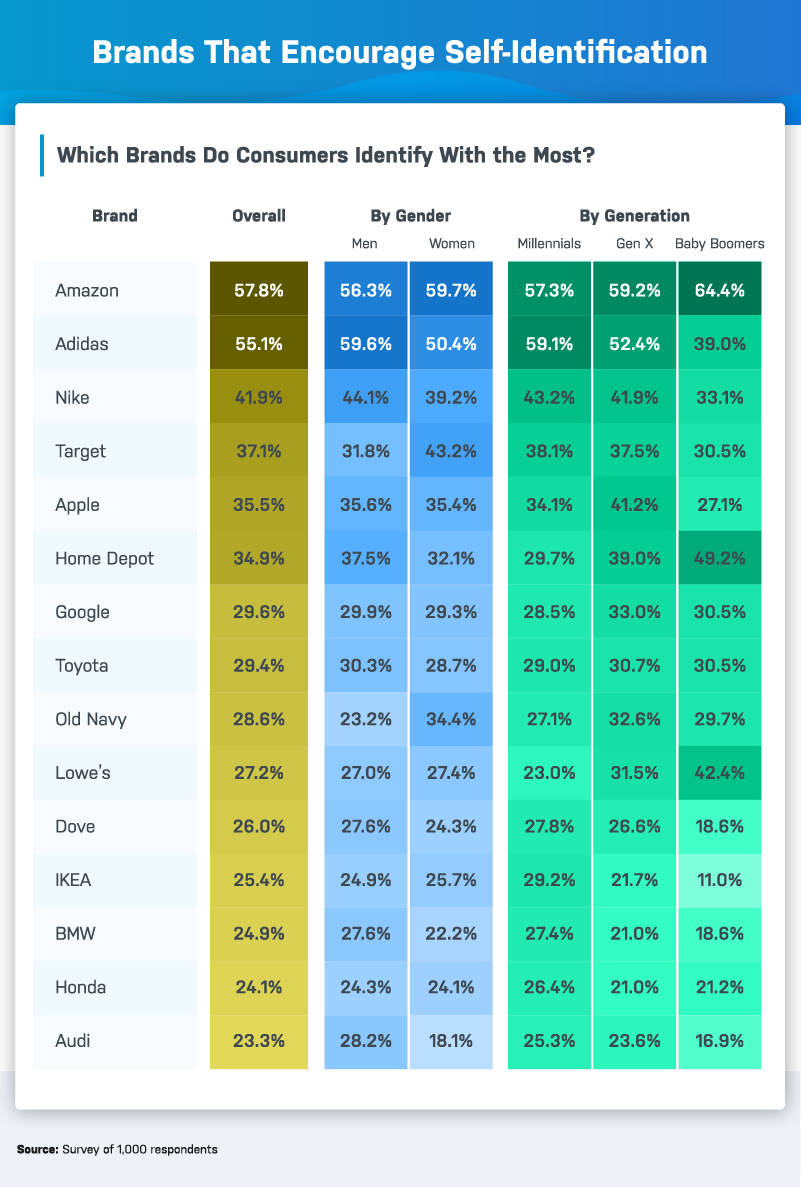
Per our survey results, the overall top five brands respondents identified with were Amazon (57.8%), Adidas (55.1%), Nike (41.9%), Target (37.1%), and Apple (35.5%). These five brands fell into three industries, two in technology, two in athletic, and one in home goods. Why did so many respondents identify with these brands? As we further assess brands from different industries, we will explore some diversity motives these brands have enacted and how they have helped influence their popularity.
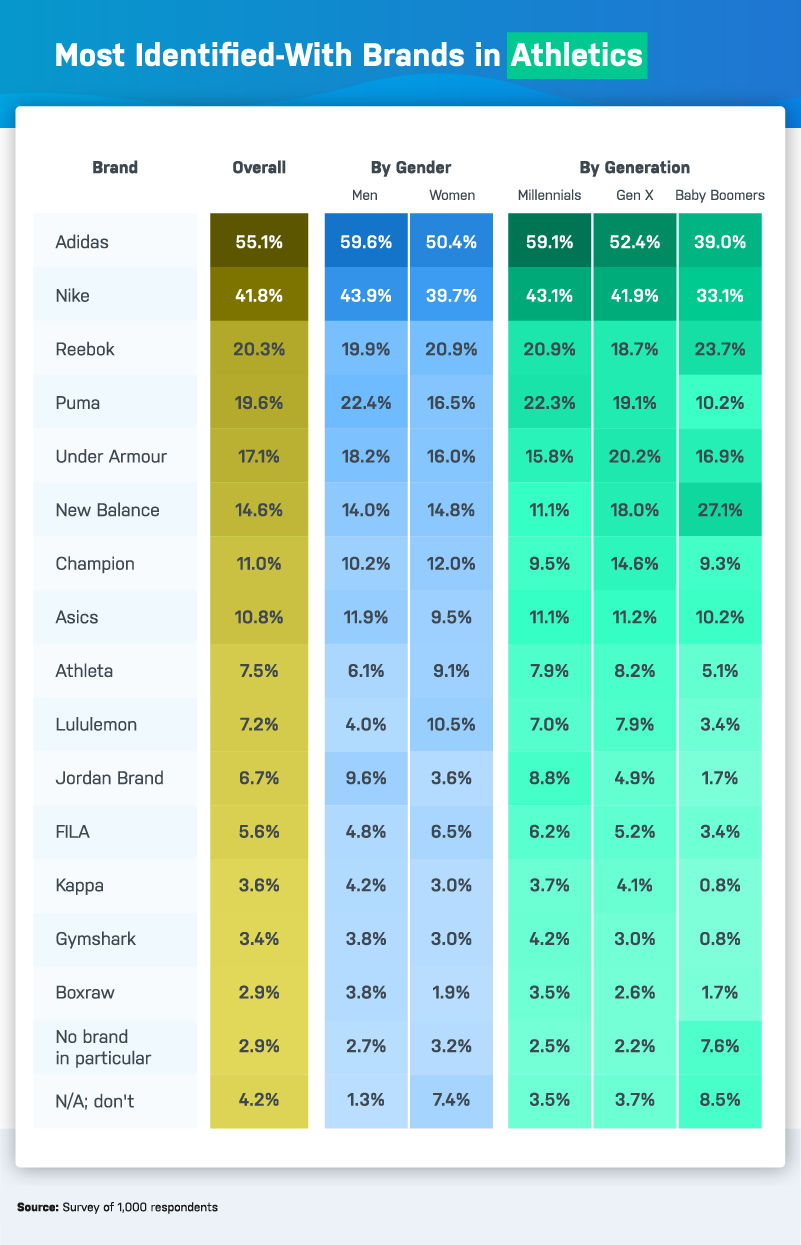
Although Adidas ranked highest in the athletics industry in terms of respondents that identified with the brand, other brands in this industry have made greater strides toward diversity and inclusion. Last year, Adidas made a public statement that 30% of their new hires would be Black or Latino due to internal inclusion struggles. Outwardly, a different story of diversity is portrayed through partnerships with influential members of Black culture and sports. However, as of 2020, their executive board was 0% Black and only 17% female. This lags behind competitors Nike (15% Black, 31% female) and Puma (16% Black, 33% female).
Nike, ranked second in athletics and third overall, has promoted diversity within their company as well as in branding efforts. Since 2016, ethnic minorities have contributed to more than half of Nike employees. More recently, in December 2020, Nike’s “You Can’t Stop Us Campaign” went viral. In less than two weeks, it had over 20 million views on Twitter alone. The ad featured disabled and abled athletes of different genders and races to illustrate a story of diversity and inclusion. It deeply resonated with white and non-white consumers, making them equally likely (52%) to make a purchase after viewing the ad.
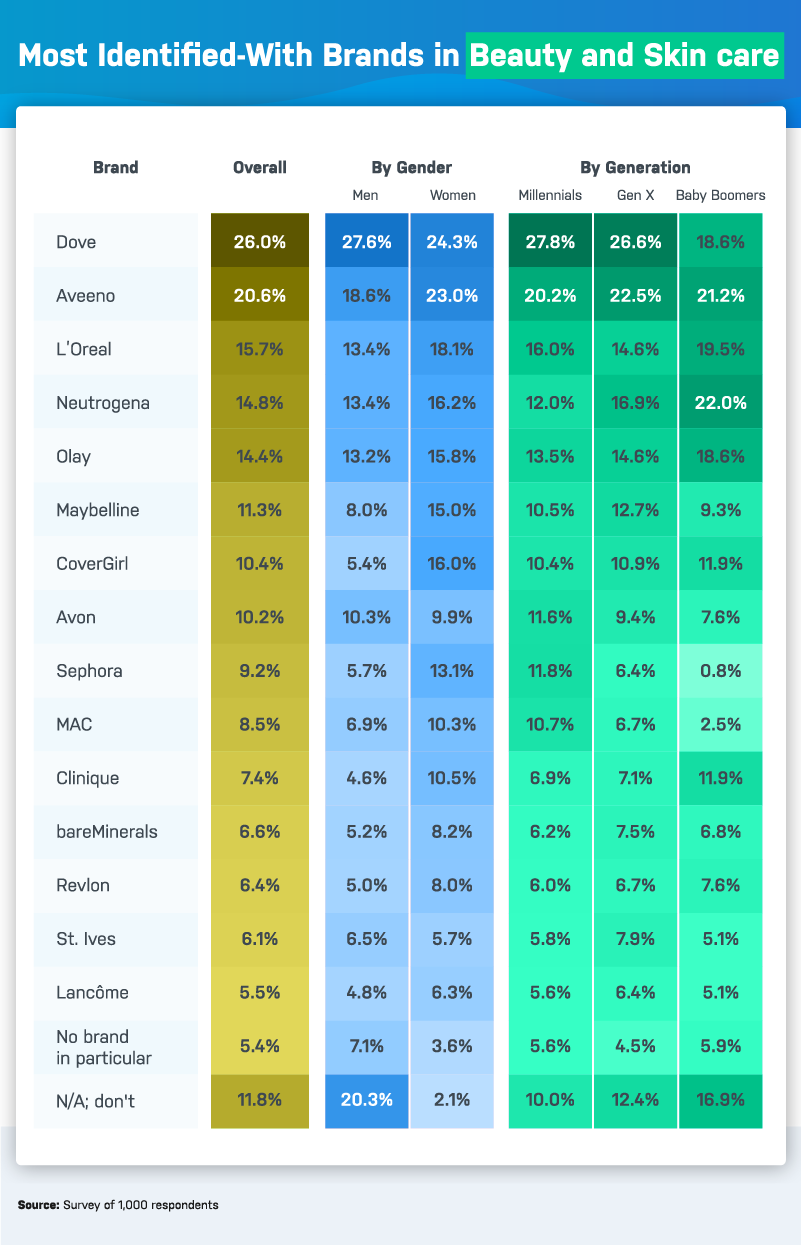
Dove ranked highest in the beauty and skin care industry, with 26% of respondents identifying with the brand. In 2004, Dove launched their “Campaign for Real Beauty” which celebrated body positivity and racial diversity among women. That campaign evolved into the “Real Beauty Pledge” the brand uses today. Aspects of this pledge include showing everyday women (not models) in branding and advertisements. They also feature women of all shapes, sizes, and ethnicities and never retouch images.
A goal of this is to help young girls build confidence and self-esteem in a world where media presents a standard of beauty that is unachievable to most. Most recently, Dove launched the “It’s On Us” campaign, where “real” models infiltrate casting calls for other companies, and, if selected, have their fees paid for by Dove as long as they are portrayed as they really are. With such a focus on diversity for women, it is interesting that more of our male (27.6%) respondents identified with Dove as a brand than women (24.3%).
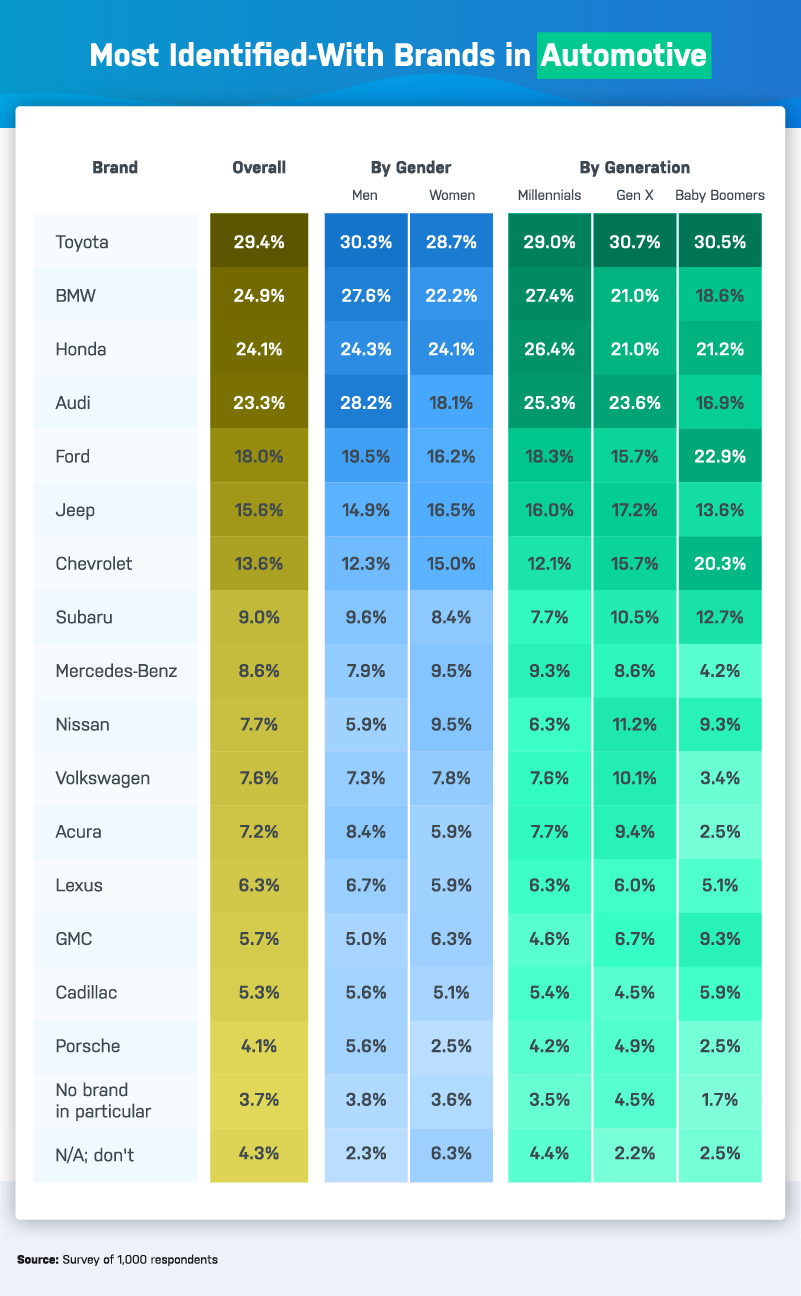
Toyota was the leader of the automotive industry, with 29.4% of respondents identifying with the brand. The car manufacturer promotes diversity internally through D&I development programs for employees while fostering LGBTQ+ inclusive culture. In 2021, they ranked seventh out of the top 50 companies for diversity, according to DiversityInc. The only other auto manufacturer to make the cut was General Motors ranking 38. General Motors includes Chevrolet, GMC, Cadillac, and Buick. Three of these 4 were brands our respondents identified with. Buick was not included, while Chevrolet (13.6%) was the highest ranking GM vehicle of those we surveyed. Both Toyota and GM have made efforts to foster diversity in an industry that sometimes lacks it.
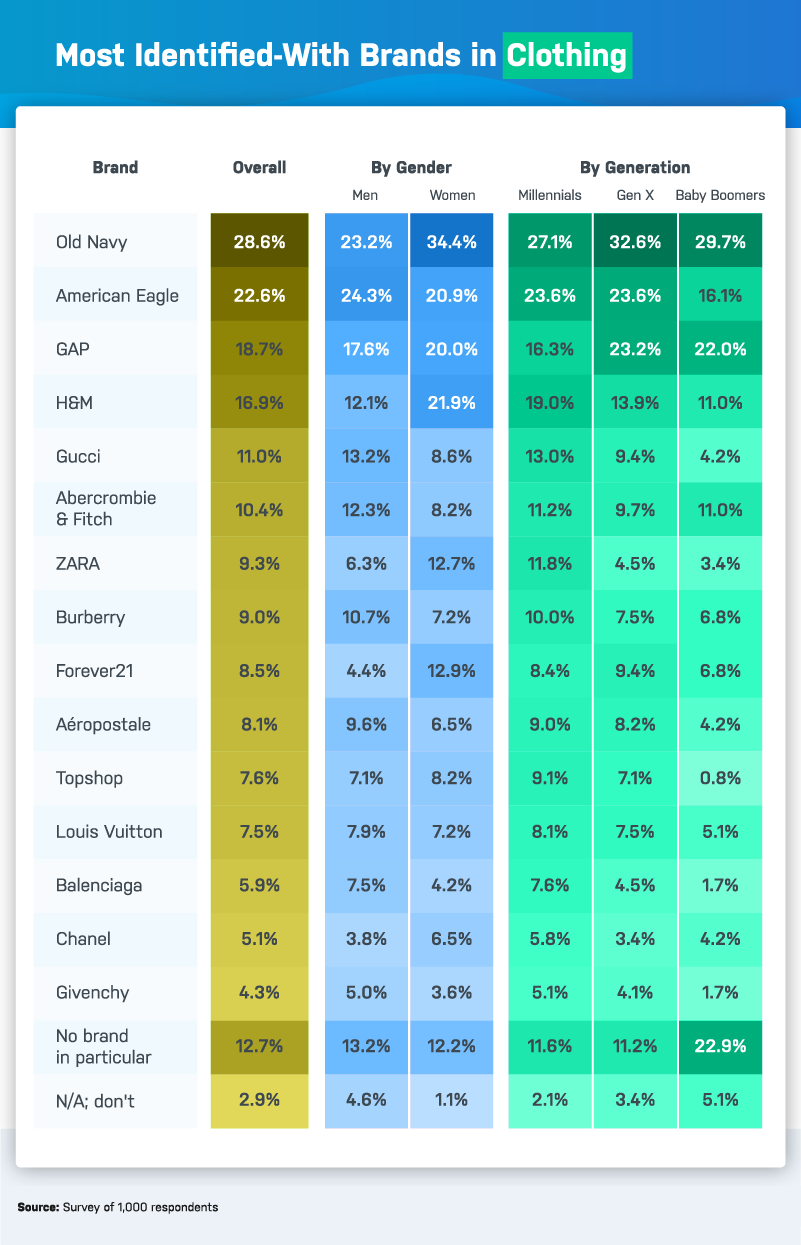
Old Navy was the top clothing brand our respondents identified with at 28.6%, with women (34.4%) and Gen Xers (32.6%) most likely to feel this way. Old Navy is owned by GAP, which ranked third (18.7%). Recently Old Navy has enacted their “Bodequality” philosophy which includes expanded sizes available in store. Recent advertisements include a plus-size SNL cast member to promote this permanent branding change. In-store size ranges have been extended to size 28; however some argue that this policy change is undermined by the brand’s decision to exclude one size (size 30) from in-store racks.
American Eagle, another clothing retailer, was second (22.6%) on the list of brands respondents identified with. American Eagle owns Aerie, short for American Eagle lingerie. Similar to Dove’s initiatives, they show real bodies that are not airbrushed. Models are real women that are racially diverse, body diverse, and may have disabilities. One of these AerieReal models posed untouched in her underwear showing her ostomy bag. This promoted IBD awareness, which is an often unseen disability.
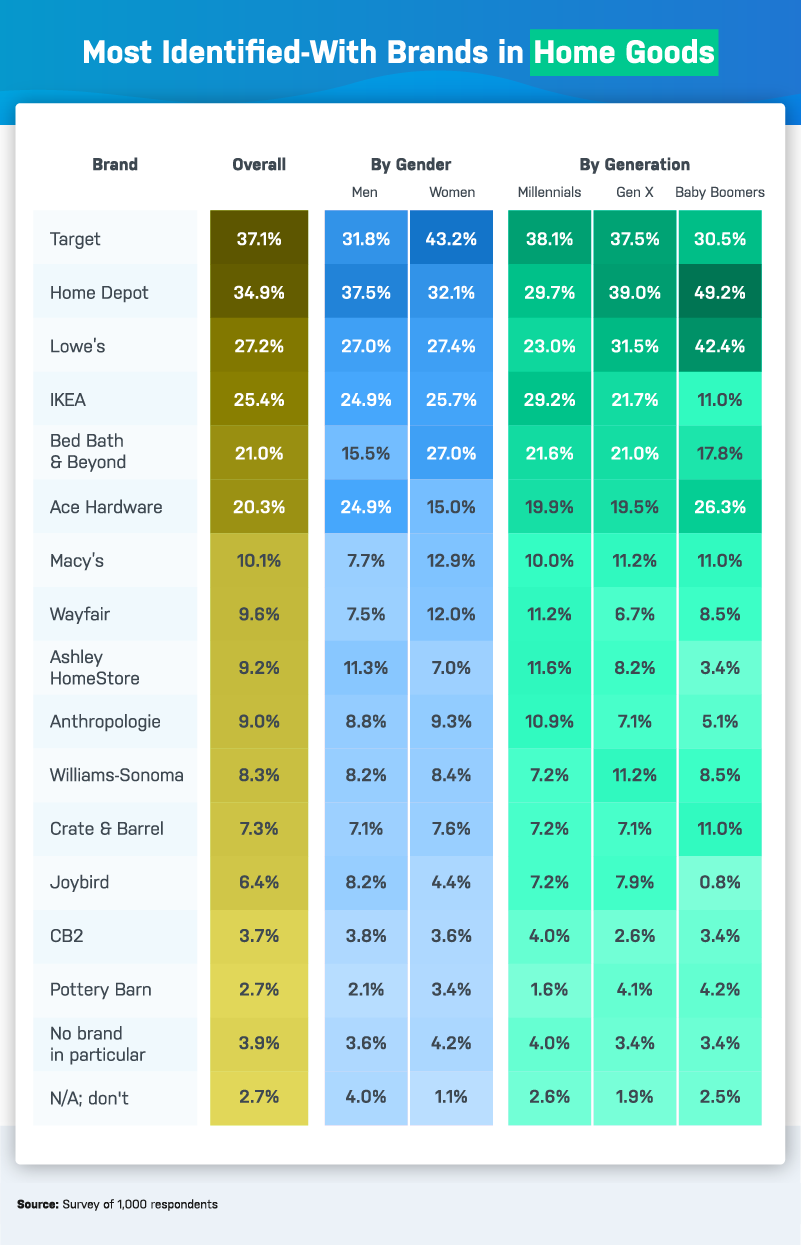
Well known for their red bullseye, Target was No. 1 (37.1%) in the home goods category. Specifically, women (43.2%) and millennials (38.1%) were most likely to identify with this brand. In-store images include racial diversity and disability inclusion. Other brand initiatives include a monetary commitment to support black-owned businesses as well as resources to help owners grow their businesses for mass retail.
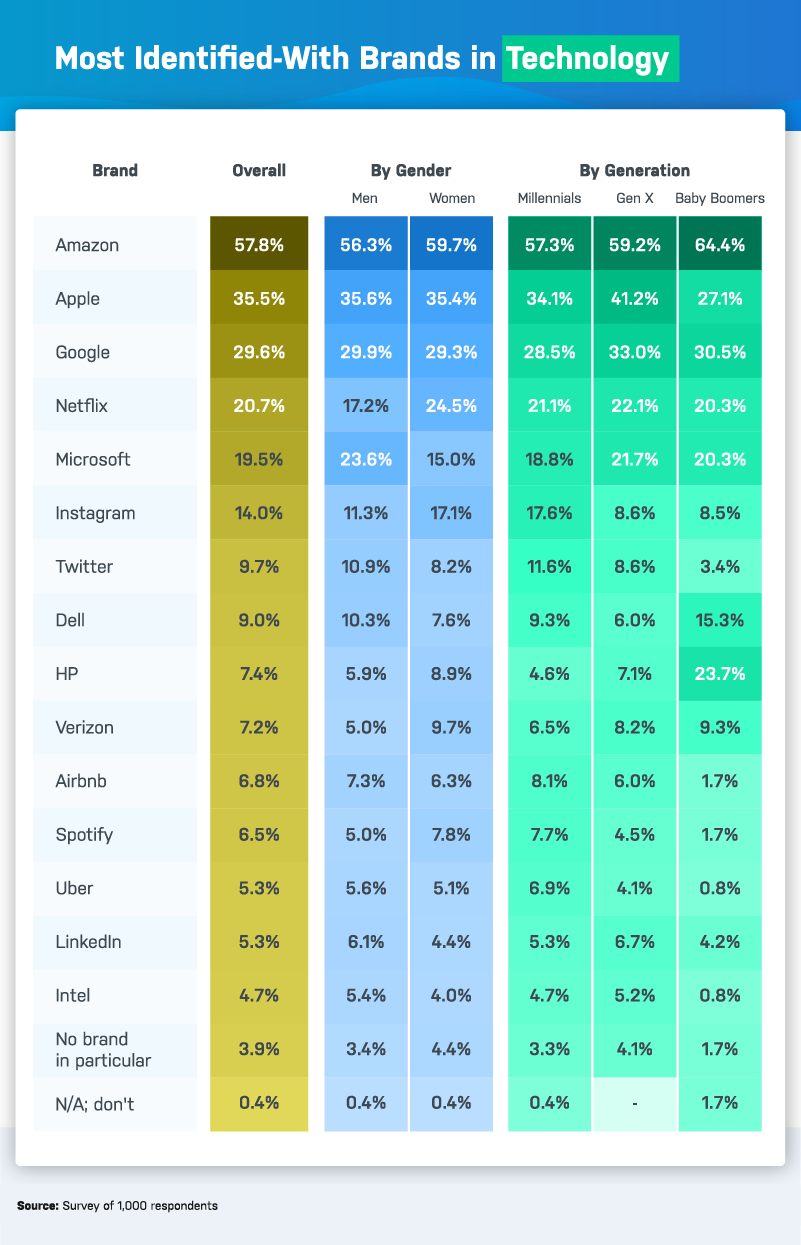
Apple was ranked second in the technology industry, with 35.5% of respondents identifying with the brand. As of 2020, 53.5% of their employees and 41% of leadership were minorities. They have also partnered with Michigan State University to open the Apple Developer Academy, which fosters the growth of young Black entrepreneurs. MSU is located in Detroit, a majority-Black city considered a Midwest tech hub.
Including Without Excluding
After analyzing hundreds of branding images from 114 different companies in six industries, we were able to identify patterns of representation in branding. It is most common for advertisers to use women or young adults in their 20s. When it comes to racial diversity in adverts, brands can certainly benefit from increasing individual minority representation to create a more even balance overall. LGBTQ+ and disability representation were less common and perceived by our respondents as less important to include in commercial branding.
However, inclusion of all kinds of diversity is essential, not only for ethical reasons but because consumers are more likely to make purchases from brands they identify with personally. Representation of diversity is not always an easy feat for marketers, especially because including a certain target demographic can often mean excluding another.
Optimized SEO can assist a company to reach their diversity and inclusion goals. Whether these goals are met will shape consumers’ perception of your company. Visit Best SEO Companies to see which SEO companies represented the brands consumers identified with most in this study.
Methodology and Limitations
For the first half of this study, we gathered 340 branding images from 114 different companies within six main industries: athletics, beauty and skin care, automotive, clothing, home goods, and technology. Each of these images was manually tagged to include the gender, race, and age range along with any other forms of diversity shown.
No statistical testing was performed, so the claims listed above are based on means alone. As such, this content is exploratory and is presented for informational purposes only. The image gathering took place during September 2021.
For the second half of this study, we surveyed 1,000 respondents on Amazon MTurk to gather their sentiments on representation in branding. 52.2% of respondents identified as men, 47.4% identified as women, and the remaining 0.4% identified as nonbinary. The average age of respondents was 39.3 years, and the standard deviation was 11.8 years.
The main limitation of this portion of the study is its reliance on self-report, which is faced with several issues, such as, but not limited to the following: attribution, exaggeration, recency bias, and telescoping.
Fair Use Statement
If you want to help your readers learn more about increasing representation through diversity in branding, please feel free to share this article for noncommercial purposes. All we ask is that you give us fair representation by linking back to our research.